 |
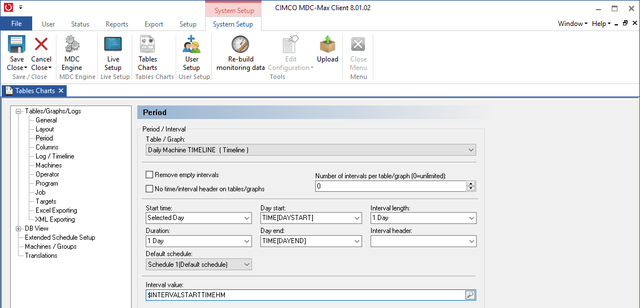
Click on the Period menu on the left to determine the timescale of the Timeline.
|
"Start Time" and "Duration" determine the total period of the timeline. Selected Day means that when we run the graph the user will be able to select a day from a calendar. We want to report on a single day so the duration is 1 day.
A timeline would usually be set up for a whole day so the interval length should be set to 1 day, this will display a whole day on one page. The "Day Start" field is set to TIME[DAYSTART] - this means the graph will start at the beginning of the first shift.
The "Day End" is set to TIME[DAYEND] so the graph ends at the end of the final shift.
If your first shift starts at 6 am and you run three shifts ending at 6 the next morning, the graph above will run from 6 to 6, not from Midnight to Midnight.